Simple and Scalable Predictive Uncertainty Estimation using Deep Ensembles
Idea
Problems:
- Its hard to quantify uncertainty with classic ANNS as ground truth is not available. They usually produce over-confident results due to a lack of calibration.
- Bayesian NN can quantify it but are slow to compute, prior-dependent, and quality depends on the degree of approximation taken.
This paper combines multiple ideas to get an estimation of uncertainty:
Use a 2-output network
One output for the mean \(\mu\) and the other for the variance of the guess \(\sigma\) as in Estimating the mean and variance of the target probability distribution. Samples are treated as from taken from a heteroscedastic Gaussian distribution. They then use a Maximum Likelihood Estimation (MLE) on \(\mu\), \(\sigma\), minimizing the negative log-likelihood:
\begin{equation} -\log p_\theta (y | x) = \frac{\log \sigma_\theta^2 (x) }{2} + \frac{(y - \mu_\theta (x))^2}{2 \sigma_\theta^2 (x)} + constant \end{equation}
Notice the trade-off between \(\mu\) and \(\sigma\). The optimizer can’t just minimize \(\sigma\) faster than \(\mu\) since would make the second term grow.
Use an ensemble of networks
It is known that an ensemble of models boosts predictive accuracy. Bagging is often used to decrease variance while boosting to decrease bias. This research shows that it also improves predictive uncertainty.
Once trained, the ensemble is treated as a mixture of Gaussians of same weight. Thus the final prediction is the mean of the mixture and the uncertainty is given by the variance of the mixture. If using \(M\) models with parameters: \(\theta_1 ... \theta_M\):
\begin{equation} \mu_\star (x) = \frac{1}{M} \sum_m \mu_{\theta_m} (x) \end{equation}
\begin{equation} \sigma_\star^2 (x) = \frac{1}{M} \sum_m \left( \mu_{\theta_m}^2 (x) + \sigma_{\theta_m}^2 (x) \right) - \mu_\star^2 (x) \end{equation}
Use adversarial training
When optimizing using adversarial training, a small perturbation on the input is created in the direction in which the network increases its loss. This augmentation of the training set smoothens the predictive distributions. While it had been used before to improve prediction accuracy, this paper shows that it also improves prediction uncertainty.
Algorithm
The previously presented ideas can be combined in the following algorithm:
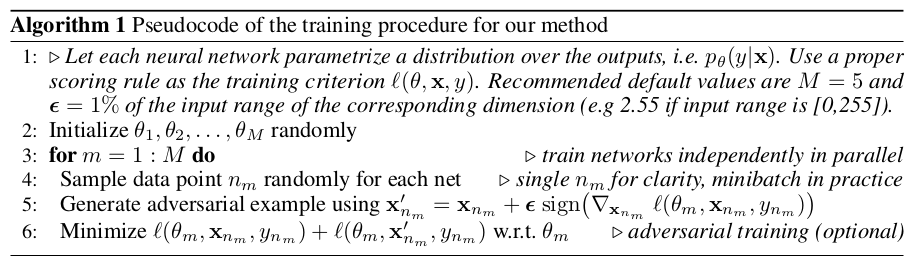
Algorithm 1: Pseudocode of the proposed approach.
Results
First they show on toy-regression examples the benefits of the 3 design choices explained above. They then test their algorithm performance on: regression, classification and uncertainty estimation.
Regression
They run their algorithm on multiple famous regression datasets (e.g. Boston Housing).
- Their algorithm generally outperforms PBP and MonteCarlo-Dropout algorithms using a negative log-likelihood (NLL) error metric.
- It performs slightly worse when using a root mean squared error (RMSE) metric for comparison. Authors claim this is due the fact that the loss they used whilst training was NLL.
Classification
They test classification performance on the MNIST and SVHN datasets.
- Adversarial training and a greater number of networks improve performance both for classification and calibration.
- The proposed method works better than MonteCarlo-Dropout.
Uncertainty estimation
The paper evaluates uncertainty on out-of distribution examples (i.e unseen classes). To do so, they run the following experiment:
- Train ensemble on MNIST train dataset.
- Evaluate both on MNIST test (in-of distribution) and NotMNIST (out-of distribution). This evaluation consists in computing the entropy of network predictions. The expectation is that out-of distribution examples present a uniform probability over outputs (with 10 outputs the entropy should be around \(H=-\sum_{i=0}^9 \frac{1}{10} \log_2 (\frac{1}{10}) \simeq 3.32\)).
They repeat the same experiment using the SVHN dataset for training and CIFAR10 for testing. Results show that with a big enough ensemble their method is better calibrated than MonteCarlo-Dropout. They can better estimate the uncertainty for out-of distribution inputs:
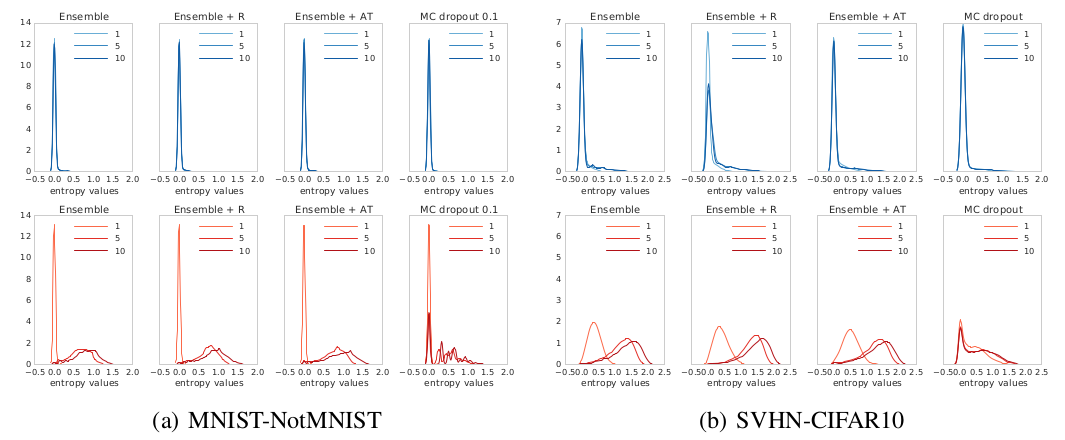
Figure 1: Entropy histograms for experimental results. Top row: in-of distribution test results. Bottom row: Out-of distribution test results. Notice that MC-dropout produces much over-confident results for inputs of an unseen distribution. In addition the number of networks in the ensemble plays a key role in uncertainty estimation.
One can set a minimum confidence level (entropy score) to the model, otherwise output “I don’t know”.
They show that their algorithm provides more reliable confidence estimates compared to MC-Dropout.
Contribution
- New method to estimate uncertainty more reliable than contemporary ones.
- Little meta-parameter tuning.
- Easy to implement and apply to large scale distributed systems.
Weaknesses
- Training an ensemble is computationally expensive and can be prohibiting in some cases.